
Introduction to Chart Analysis


What is Chart Analysis
Analyzing charts is an important tool for anyone interested in the stock or crypto market. By analyzing chart patterns using technical indicators, investors can make informed decisions about when to buy and sell crypto. I will argue that chart analysis is essential for anyone looking to succeed in the crypto market.
First and foremost, chart analysis helps investors identify trends and predict future price movements. By analyzing chart patterns, investors can get a sense of whether a stock is likely to go up or down in the short term. Technical indicators, such as moving averages and relative strength index, can also provide valuable insights into a stock's performance. By using these tools, investors can make more informed decisions about when to buy and sell.
Advantages
In addition to helping investors predict price movements, chart analysis can also provide valuable insights into a stock's risk and volatility. By analyzing chart patterns and technical indicators, investors can get a sense of how much risk a stock carries and whether it is likely to be more or less volatile than other stocks. This can be especially useful for investors who are looking to diversify their portfolios or manage risk.
Another advantage of chart analysis is that it can help investors make more objective decisions. Rather than relying on subjective opinions or emotions, chart analysis allows investors to base their decisions on data and objective analysis. This can be especially useful in times of market uncertainty, when it can be difficult to make sense of conflicting opinions and headlines.
In conclusion, chart analysis is an essential tool for anyone looking to analyze stock or crypto market.
I use “Pro bundle” to analyze charts on tradingview.com. For more details click here
2 Simple Rules For Chart Analysis
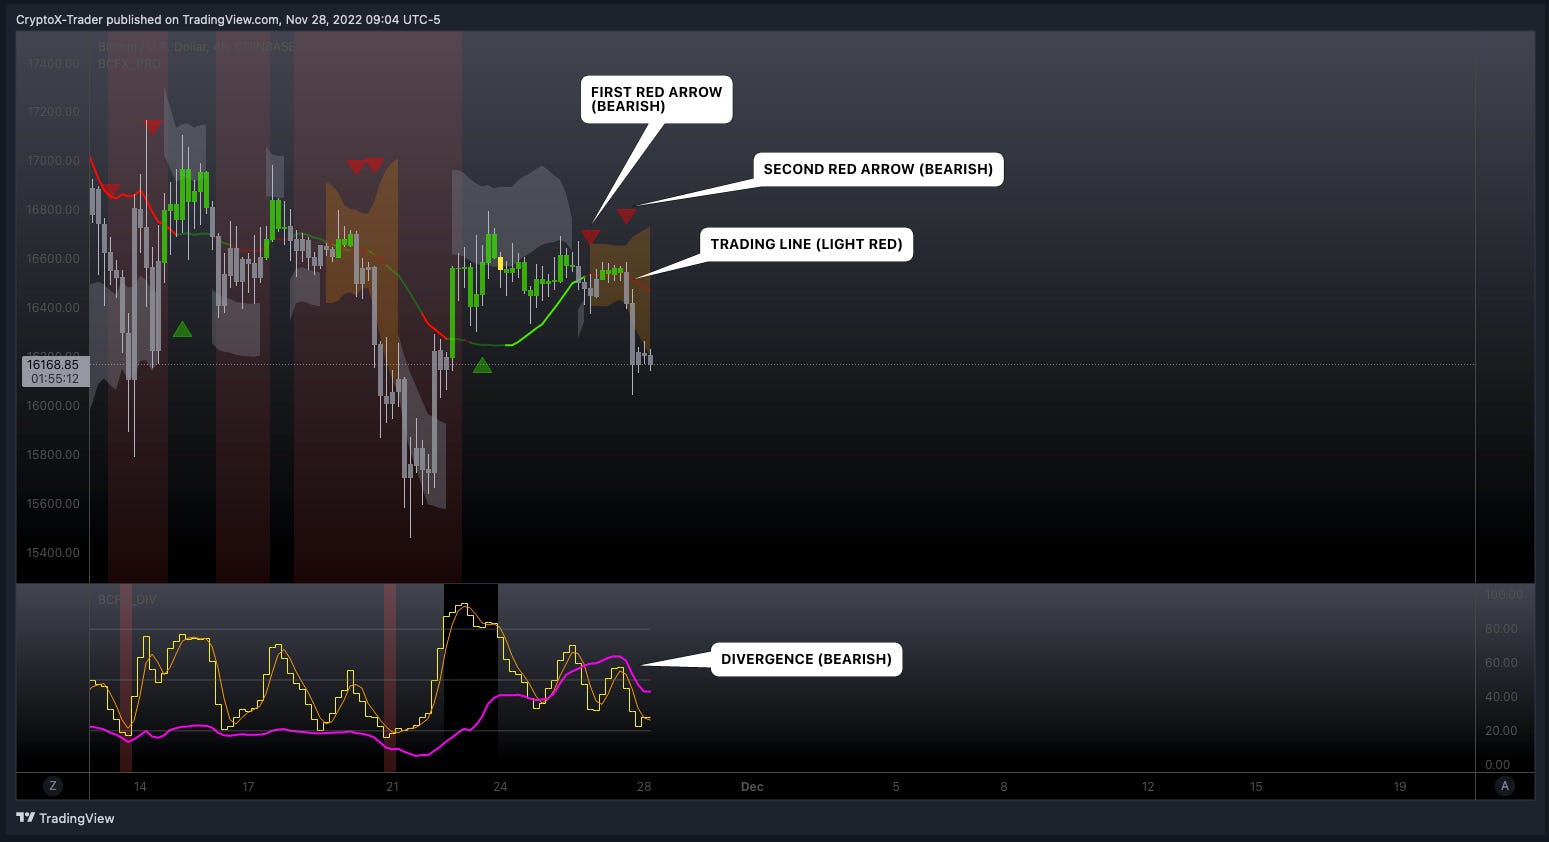
📊Follow the trading line (green is bullish, red is bearish)
📊Follow the arrows (green is bullish, red is bearish)
Below chart shows #BTC went from 16563 to 16166. First red arrow printed 16hours before price dropped.
Gain An Edge In Chart Analysis By Following 1 Simple Rule
📊Follow the divergence
When the divergence is bullish, you open a long. When divergence is bearish you open a short. (Pink and yellow lines in lower chart create bullish or bearish divergence). Position your trades accordingly.
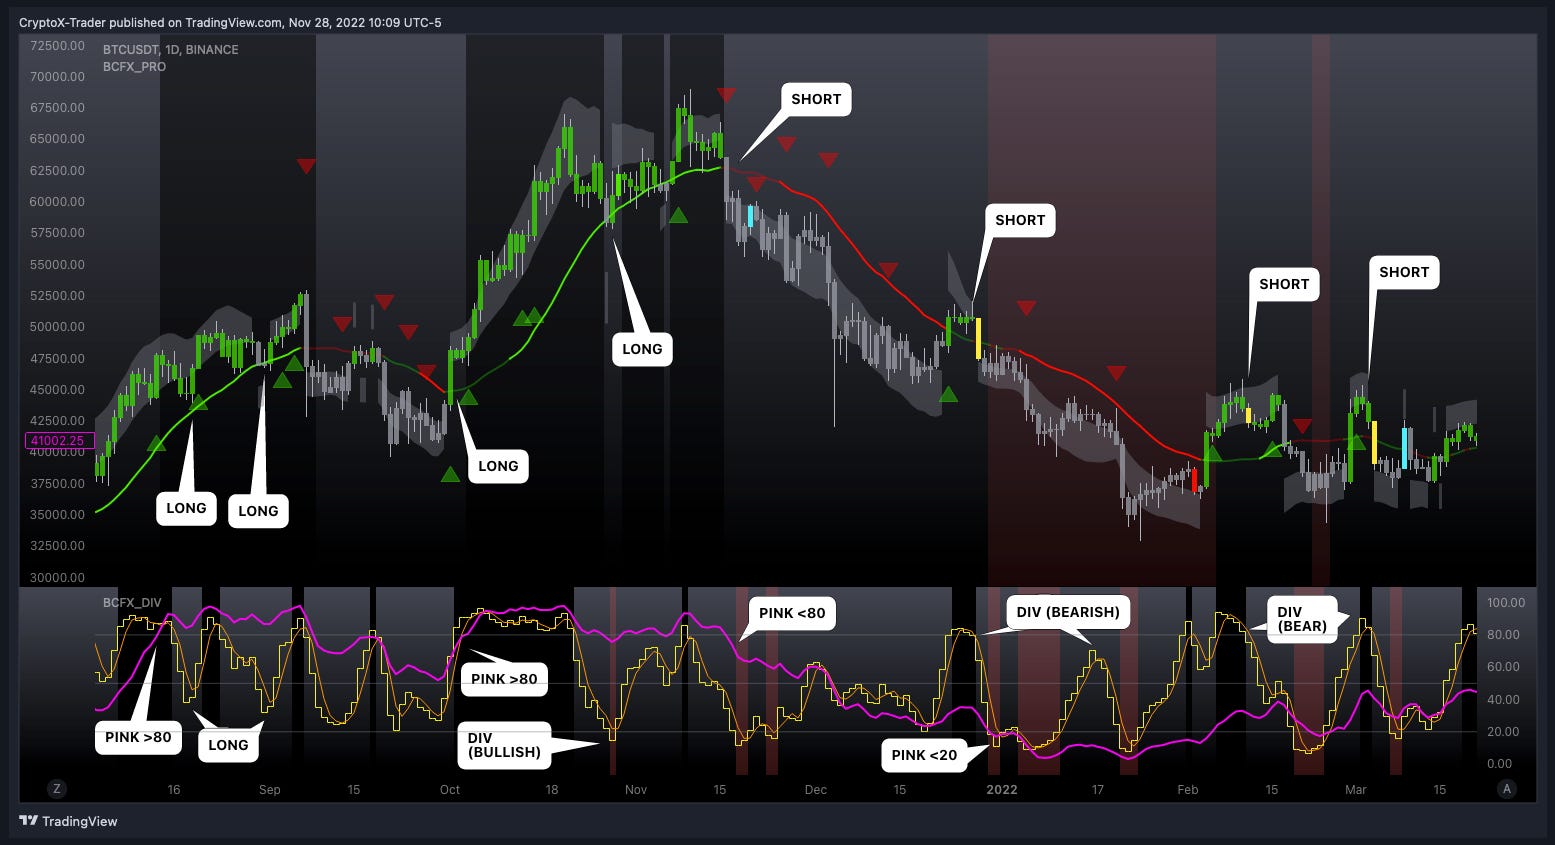
In below chart, trading line turned green with up arrow but knowing bearish divergence is in play, advanced traders will position themselves by opening shorts.

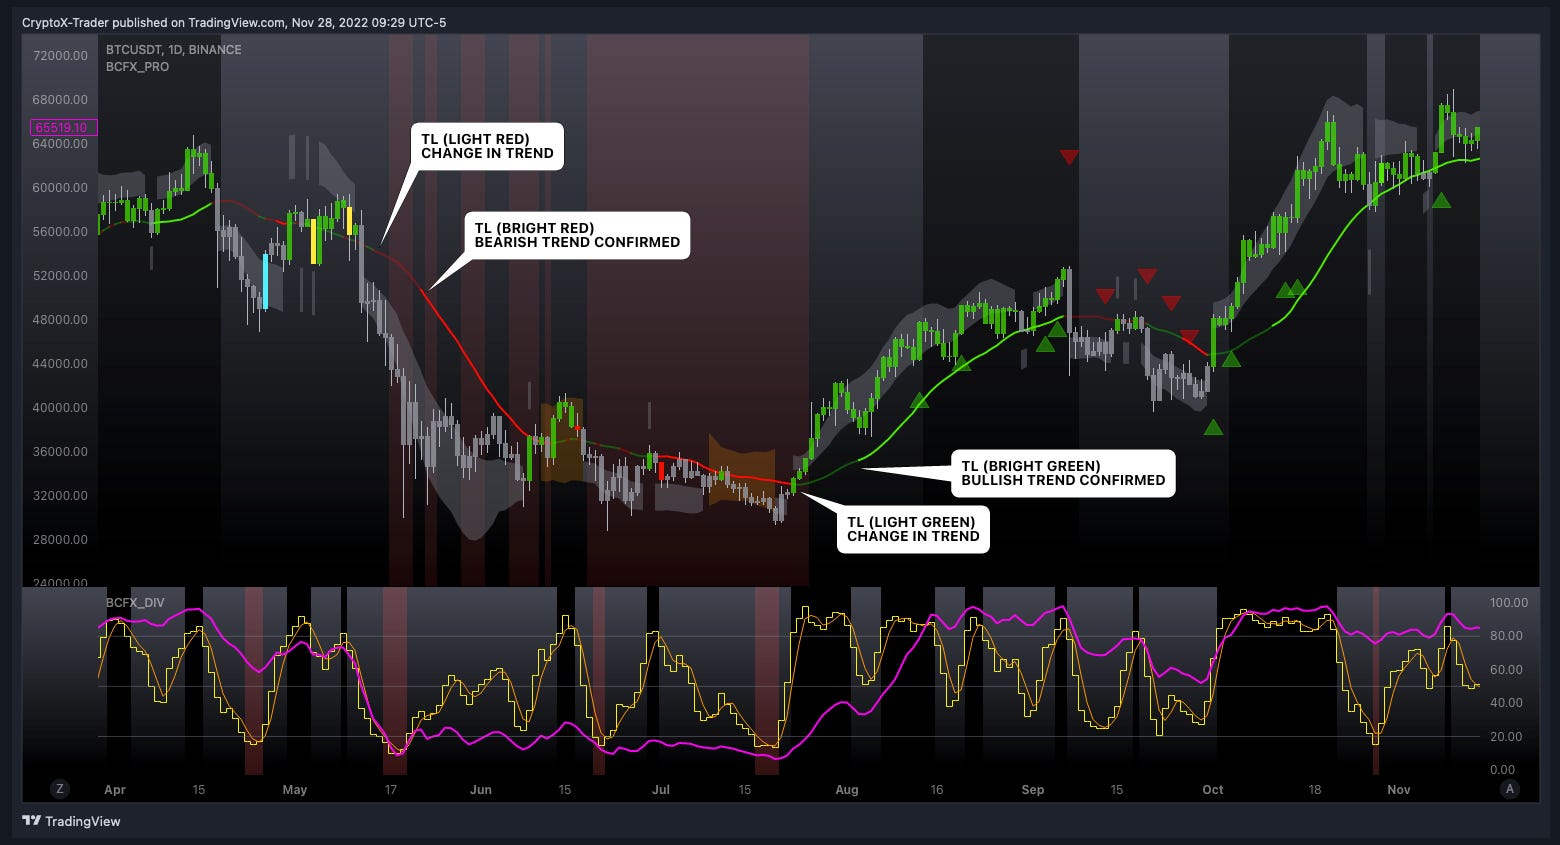
What is Trading Line
Trading Line (TL) is the center line showing 4 different colors (bright green, light green, bright red, light red). View chart
TL bright green implies trend is bullish.
TL bright red implies trend is bearish.
TL transitions light green / red implies trend is changing
How to Trade a Divergence (div)?
Follow 2 lines (pink and yellow) to trade div. View chart
📊Bearish Div - When pink <20 and yellow swings from above forming inverted V shape, we open a short.
📊Bullish Div - When pink >80 and yellow swings from below forming V shape, we open a long.

Chart Analysis at Your Finger Tips.
Use these 3 rules to analyze any chart ($BTC $ETH $MATIC $BNB $SPY) and trade like a pro!
📊Follow the divergence (Pink>80 is bullish / long, Pink<20 is bearish / short)
📊Follow the trading line
📊Follow the arrows (up or down)
For more details on chart analysis, refer below links
Bull Trap Scenario (click here)
Bear Trap Scenario (click here)
Trend Reversals (click here)
 | A guest post by
|